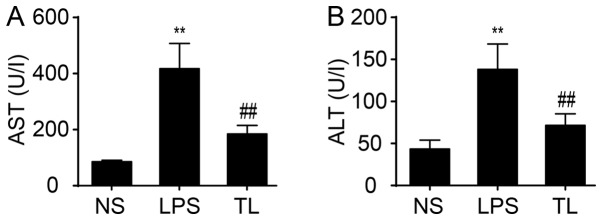
Figure 1.
Effects of taurine on the levels of (A) AST and (B) ALT. Data are presented as the mean ± standard deviation (n=10). **P<0.01 vs. NS group and ##P<0.01 vs. LPS group. AST, aspartate transaminase; ALT, alanine transaminase; NS, normal saline group; LPS, lipopolysaccharide control group; TL, taurine + LPS group.

