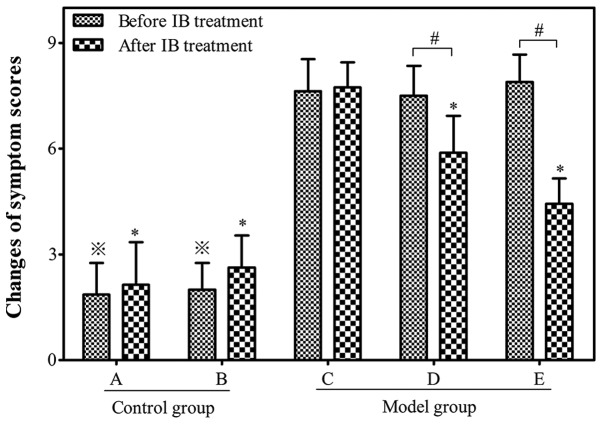
Figure 2.
Symptom scores in different groups before and after IB treatment. Control: Group A (n=7) and group B (n=8). Model: Group C (n=8), group D (n=10) and group E (n=9). Data are expressed as the mean ± standard deviation. ※P<0.05 vs. group C before IB treatment; *P<0.05 vs. group C after IB treatment; #P<0.05. IB, ipratropium bromide.

