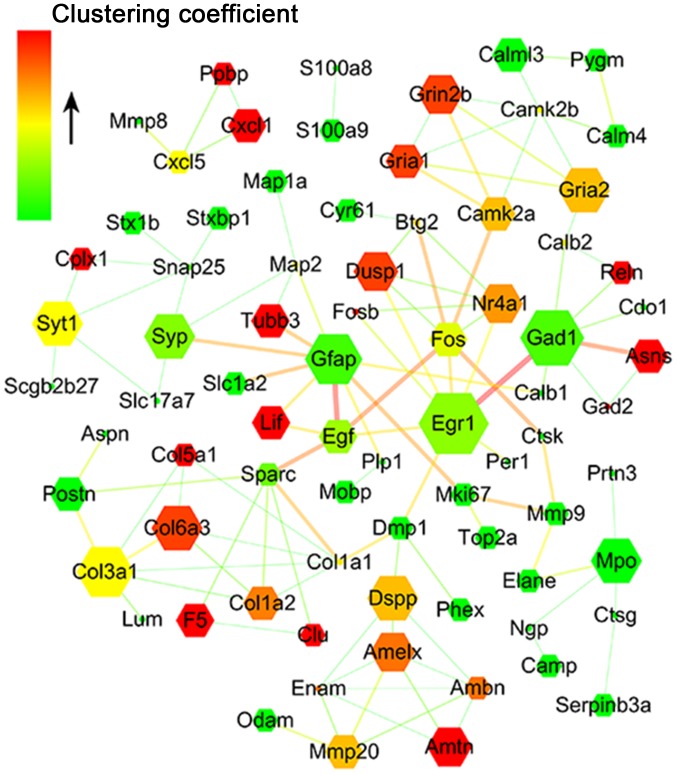
Figure 5.
PPI network for differentially expressed proteins. The gene network was constructed using Cytoscape software based on the STRING database. The circular node represents a single differentially expressed gene, and edges between nodes indicate the confidence score between them. The size of the node is correlated with the positivity degree, namely the number of genes interacting with it, and the width of the edge is positively associated with the confidence score of PPI. The colors of the nodes gradually change from green to red, reflecting the clustering coefficient depicting the positive connectivity of the nodes. PPI, protein-protein interaction.

