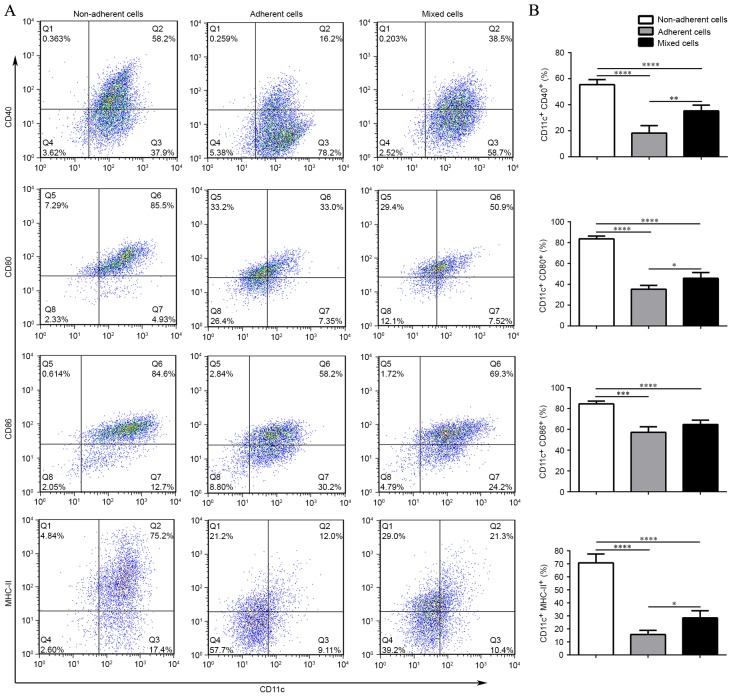
Figure 3.
Different maturation states in response to LPS stimulation among the non-adherent, adherent and mixed cells. (A) Representative flow cytometric graphs, obtained from the cell subsets stained with CD11c, CD40, CD80, CD86, and MHC-II on day 8. Non-adherent cells expressed the highest levels of CD11c+CD40+, CD11c+CD80+, CD11c+CD86+ and CD11c+MHC-II+. (B) Flow cytometric analysis demonstrating the different maturation status in response to LPS among the non-adherent, adherent and mixed cells. Error bars indicate the mean ± standard deviation; n=5/group; *P<0.05, **P<0.005, ***P<0.001 and ****P<0.0001. LPS, lipopolysaccharide; MHC-II, major histocompatibility complex class II.

