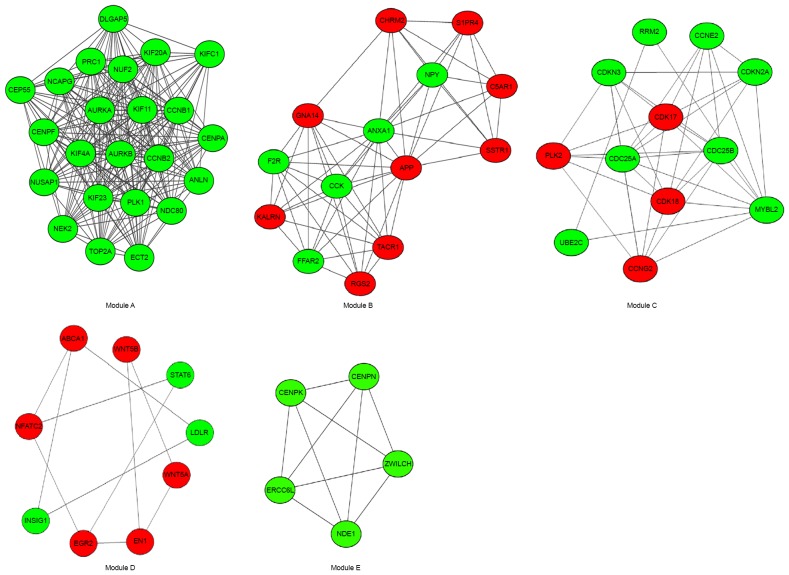
Figure 5.
Top 5 modules obtained from the protein-protein interaction network of the differentially expressed genes. The circular and triangular nodes represent proteins (triangular nodes indicate hub proteins) and the grey lines represent interactions. Red circles indicate upregulated genes and green circles indicate downregulated genes.

