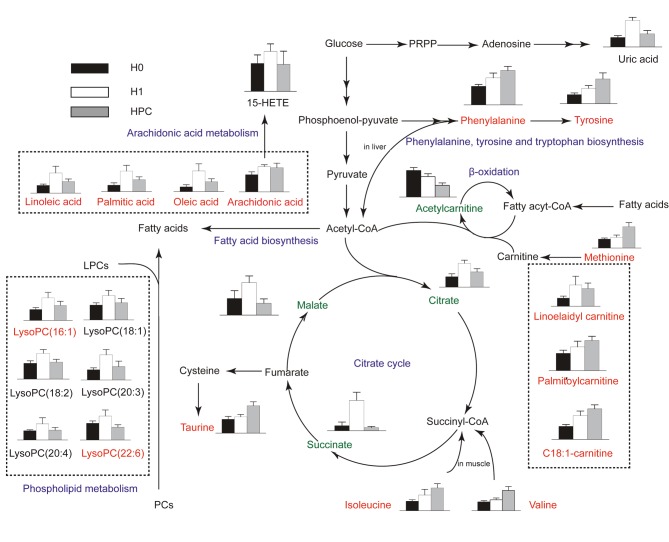
Figure 5.
Schematic overview of the metabolites and major metabolic pathways. Red represents increased metabolites; green represents decreased metabolites; blue represents associated pathways; black indicates that these were not detected in the present study. H0, normoxic control; H1, acute hypoxic; HPC, acute repetitive hypoxia; PRPP, phosphoribosyl pyrophosphate; 15-HETE, 15-hydroxyeicosatetraenoic acid; acetyl-CoA, acetyl-coenzyme A; LysoPC, lysophosphatidylcholine.

