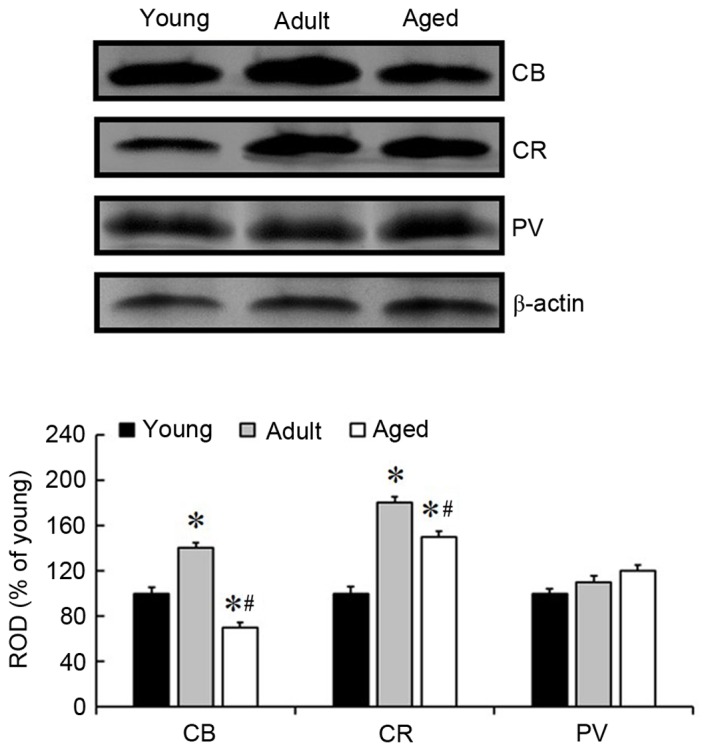
Figure 4.

Western blot analysis of CB, CR and PV in the mouse cortex of the young, adult and aged groups. ROD is expressed as the percentage of the immunoblot band values in the young, adult and aged groups. Bands were normalized to β-actin expression. *P<0.05 vs. the young group; #P<0.05 vs. the adult group. Data are presented as the mean ± the standard error of the mean (n=5/group). CB, calbindin-D28k; CR, calretinin; PV, parvalbumin; ROD, relative optical density.
