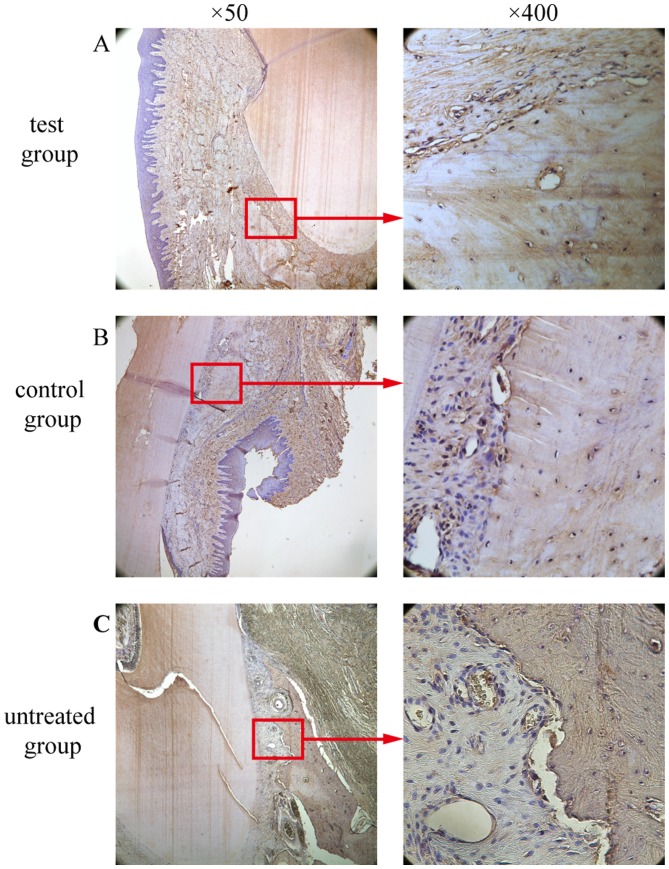
Figure 12.
Expression of OCN in the experimental groups. (A) High expression of osteocytes and osteoblasts in the test group. (B) High expression of osteocytes and osteoblasts in the control group. (C) Low expression in the untreated group. Boxed areas are also presented at ×400 magnification. OCN, osteocalcin.

