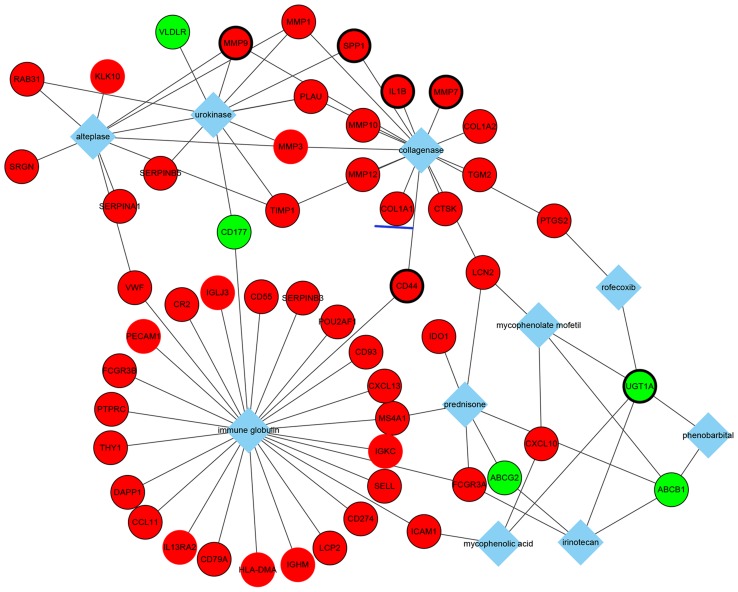
Figure 5.
Interaction network of the top 10 drugs-DEGs pairs. Red nodes indicate upregulated genes and green nodes indicate downregulated genes. Diamonds indicate drugs and lines represent interactions between drugs and DEGs. Genes circled by a black ellipse are the hub genes and the gene underlined in blue is of interest. DEG, differentially expressed gene.

