Figure 4.
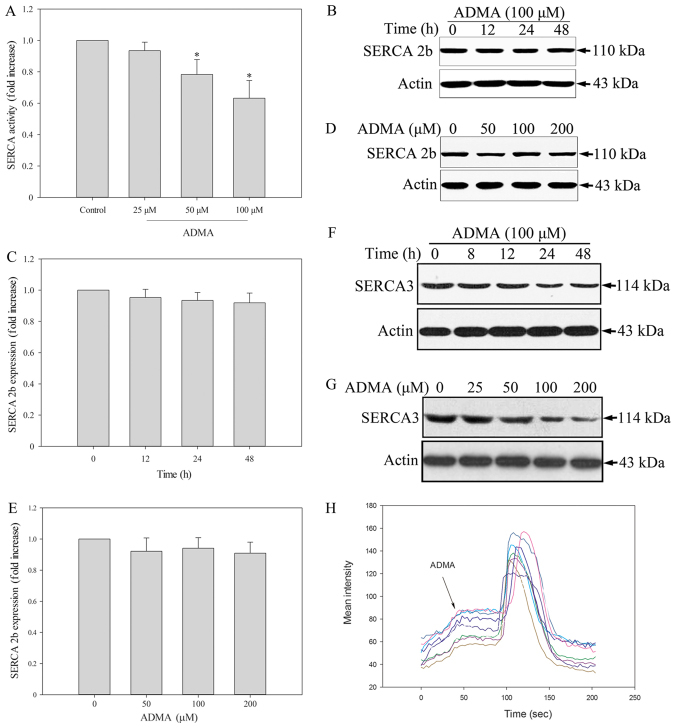
ADMA treatment leads to increased cytosolic concentrations of free Ca2+ through suppression of SERCA3. (A) HUVECs were stimulated with 0–100 µM ADMA for 24 h and SERCA activity in cell extracts was analyzed. (B-G) HUVECs were incubated with 100 µM ADMA for the indicated time periods or with various ADMA concentrations (0–200 µM) for 24 h. SERCA2 (B-E) and SERCA3 (F and G) levels were determined by immunoblotting. Results are the mean ± SD (n=3). *P<0.05 compared with control. (H) HUVECs were preloaded with Fluo-3 AM, and then stimulated with 75 µM ADMA. Serial Ca2+ images of Fluo-3 fluorescence were recorded at the indicated times (sec).

