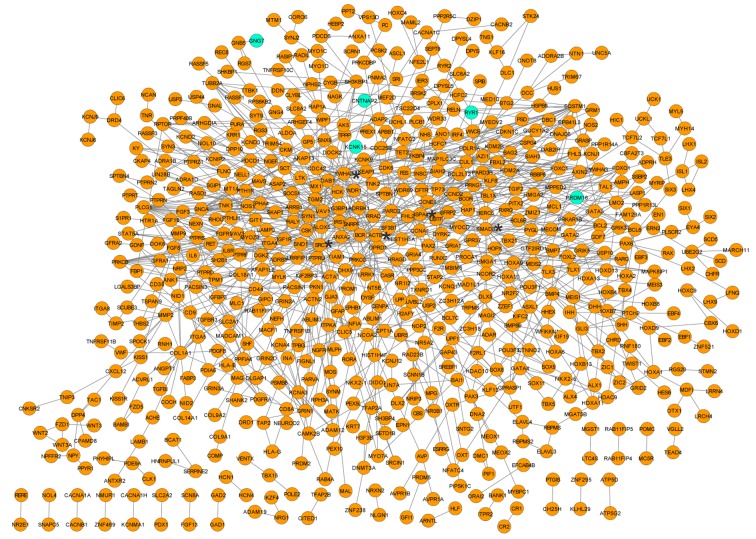
Figure 2.
Protein-protein interaction network of the overlapped genes with differentially methylated regions. Orange nodes indicate hypomethylation; blue nodes indicate hypermethylation. ‘*’ Indicates the following genes: SRC, SMAD3, YWHAZ, ACTB and HSPA4. SRC, proto-oncogene tyrosine-protein kinase; SMAD3, SMAD family member 3; YWHAZ, tyrosine 3-monooxygenase/tryptophan 5-monooxygenase activation protein ζ; ACTB, β-actin; HSPA4, Heat shock protein family A member 4.

