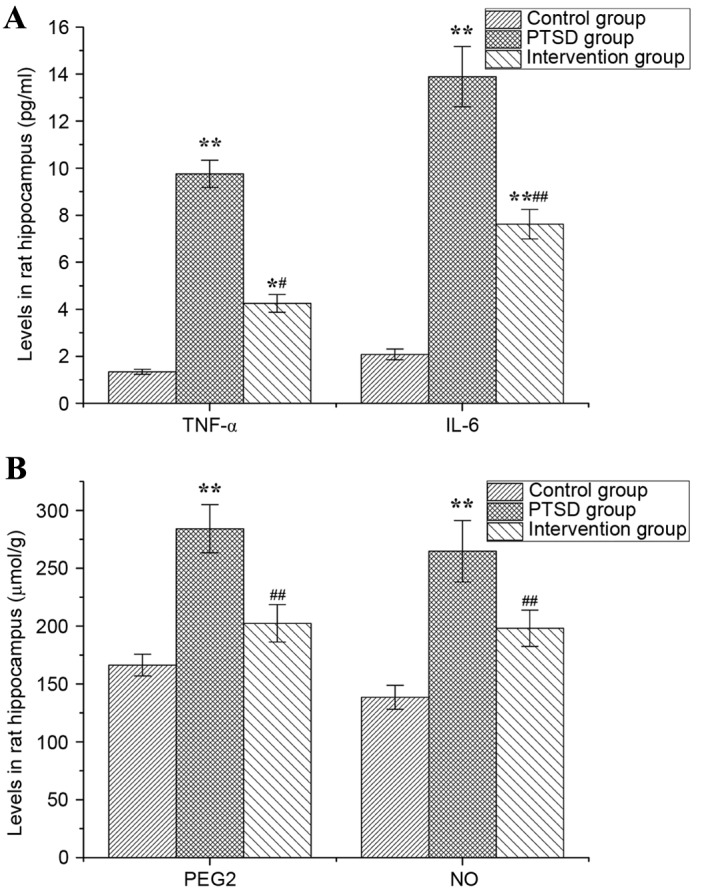
Figure 7.

Levels of TNF-α, IL-6, PGE2 and NO in rat hippocampi. The levels of (A) TNF-α and IL-6, and (B) PGE2 and NO. Data are expressed as the mean ± standard deviation (n=6). *P<0.05, **P<0.01 vs. the control group; #P<0.05, ##P<0.01 vs. the PTSD group. TNF-α, tumor necrosis factor-α; IL, interleukin; PGE2, prostaglandin E2; NO, nitric oxide; PTSD, post-traumatic stress disorder.
