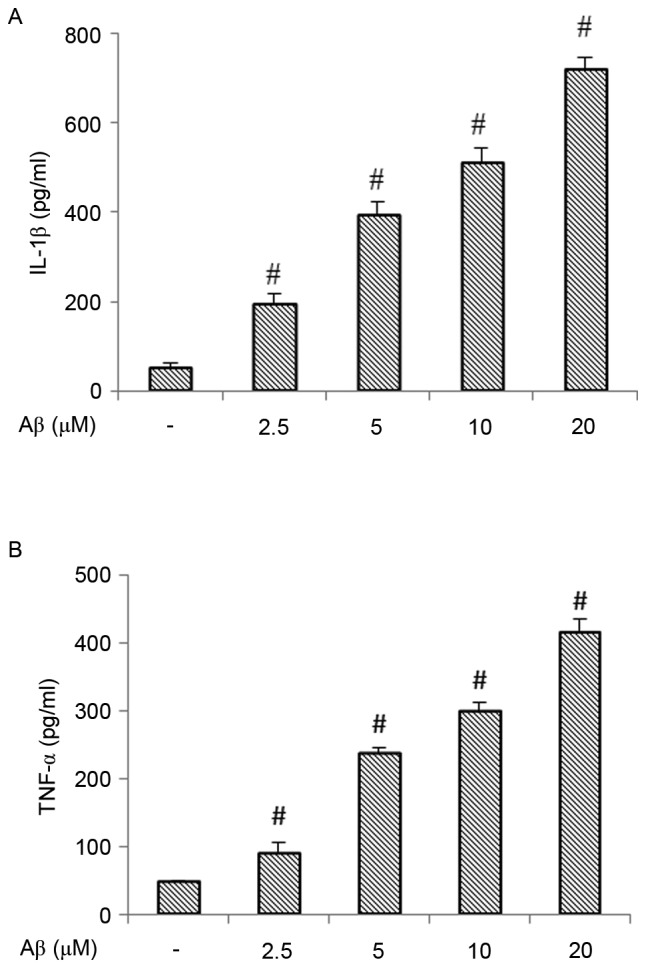
Figure 1.

Effect of Aβ (1–42) on the production of IL-1β and TNF-α. (A) Production of IL-1β in BV-2 cells treated with different concentrations of Aβ (1–42) for 12 h. (B) Production of TNF-α in BV-2 cells treated with different concentrations of Aβ (1–42) for 12 h. Each value indicates the mean ± standard deviation from three independent experiments. #P<0.01, vs. untreated control cells. Aβ, amyloid β; IL-1β, interleukin-1β; TNF-α, tumor necrosis factor-α.
