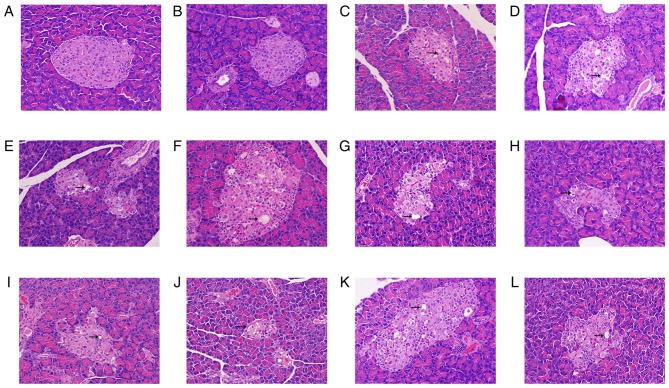
Figure 8.
Hematoxylin and eosin staining from the pancreatic tissue of type 2 diabetes mellitus model rats. All images are presented at a magnification of ×200. Pancreatic tissue of the (A) control group, (B) ND group given STZ via IP injection, (C) ND group given STZ and AON via IP injection, (D) HFSD group pre-given plus STZ and AON via IP injection, (E) HFSD group pre-given plus STZ via IM injection, (F) HFSD group pre-given plus STZ via IP injection, (G) HFSD group post-given plus STZ and AON via IP injection, (H) HFSD group post-given plus STZ via IM injection, (I) HFSD group post-given plus STZ via IP injection, (J) HFSD group simul-given plus STZ and AON via IM injection, (K) HFSD group simul-given plus STZ via IP injection and (L) HFSD group simul-given plus STZ via IM. IP, intraperitoneal; IM, intramuscular; ND, normal diet; AON, alloxan monohydrate; STZ, streptozotocin; HFSD, high fat and sugar diet.

