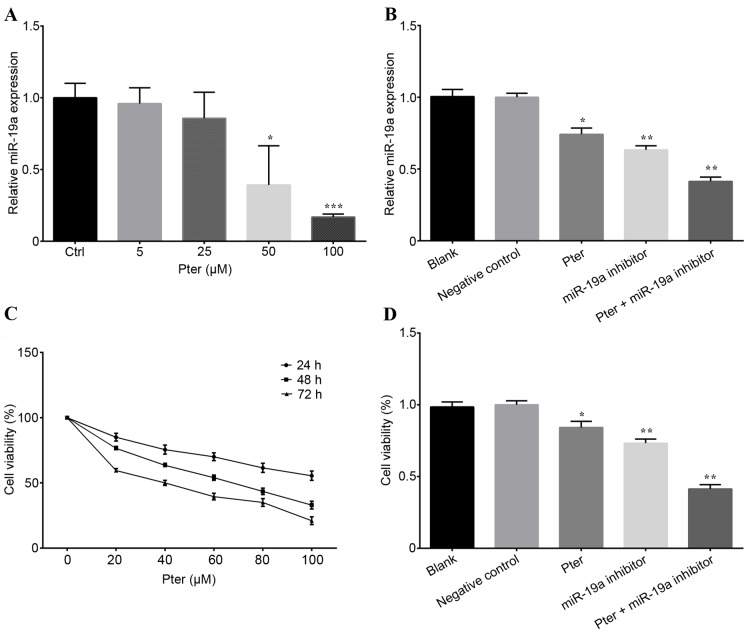
Figure 1.
Pter treatment and miR-19a inhibitor transfection affected the miR-19a expression and cell viability. (A) Cells were treated with Pter (0, 5, 25, 50 and 100 µM) for 24 h and miR-19a expression was detected by RT-qPCR. (B) Relative quantification of miR-19a expression was calculated by RT-qPCR for SMMC-7721 cells treated with 50 µM Pter, miR-19a inhibitor, 50 µM Pter + miR-19a inhibitor, negative control and blank. (C) An MTT assay was performed to detect cell viability following treatment with Pter at different concentrations (0, 20, 40, 60, 80 and 100 µM) for 24, 48 and 72 h. (D) Cells were treated with 50 µM Pter, miR-19a inhibitor, 50 µM Pter + miR-19a inhibitor, negative control and blank for 24 h. Cell viability was subsequently assessed by an MTT assay. Each experiment was performed in triplicate. Data are presented as the mean ± standard deviation. For part A, *P<0.05 and ***P<0.001 vs. Ctrl; for parts B and D, *P<0.05 and **P<0.01 vs. blank or negative control group. The Pter-only treatment group was compared with the blank control group, while the miR-19a inhibitor and Pter + miR-19a inhibitor groups were compared with the negative control group. Pter, pterostilbene; miR, microRNA; RT-qPCR, reverse transcription-quantitative polymerase chain reaction; Ctrl, control.

