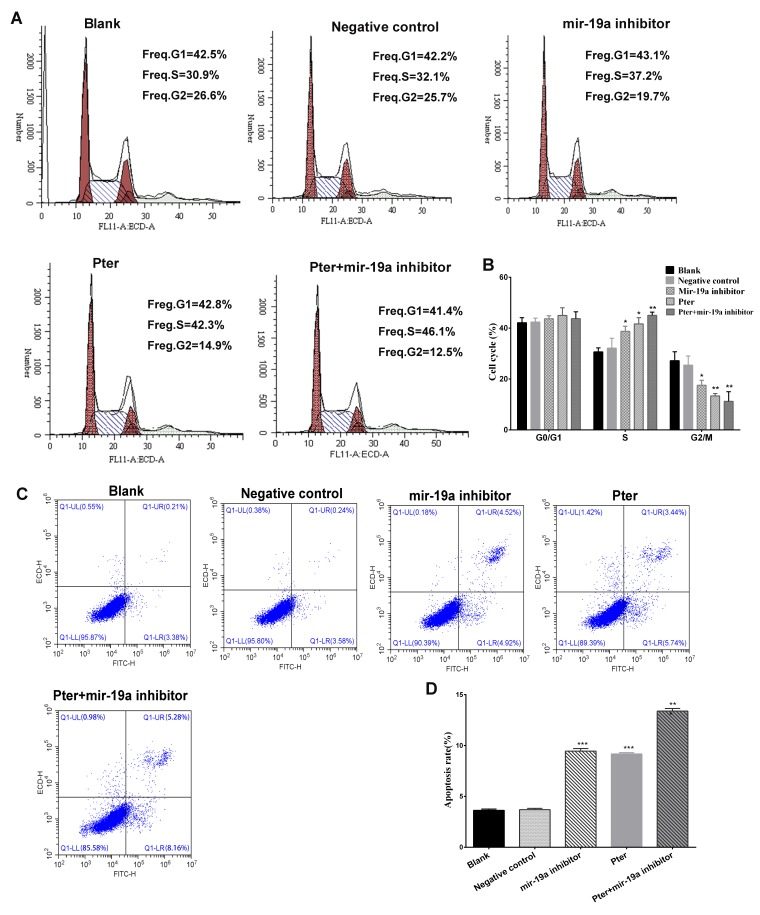
Figure 2.
Flow cytometry analysis of cell cycle and apoptotic rate. (A) Cell cycle analysis of the Pter, miR-19a inhibitor, Pter + miR-19a inhibitor, negative control and blank control groups. (B) Quantification of the cell cycle analysis for each treatment group. (C) Representative flow cytometry plots indicating the apoptotic rate (the early and late stage apoptosis) within Pter, miR-19a inhibitor, Pter + miR-19a inhibitor, negative control and blank control groups. (D) Quantification of the apoptotic rate for each treatment group. *P<0.05, **P<0.01 and ***P<0.001 vs. blank or negative control groups. The Pter-only treatment group was compared with the blank control group, while the miR-19a inhibitor and Pter + miR-19a inhibitor groups were compared with the negative control group. Pter, pterostilbene; miR, microRNA.

