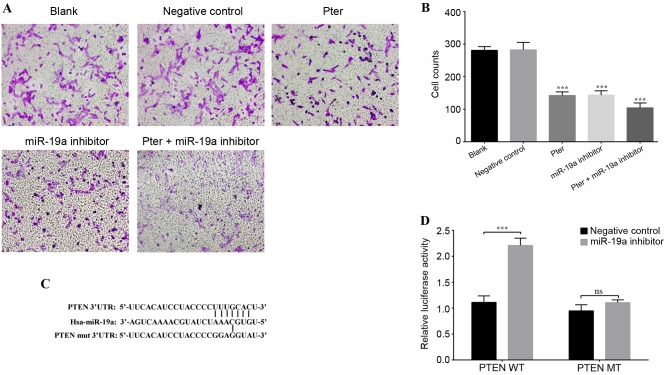
Figure 3.
Cell invasion and luciferase reporter gene assays. (A) Representative images of the lower chamber of the Transwell invasion assay in different treatment groups. (B) Cell counts using a phase-contrast microscope revealed that Pter and miR-19a inhibitor groups exhibited significantly reduced cell invasion ability. This reduction was further enhanced in the Pter + miR-19a group. (C) Binding sequence between miR-19a and WT PTEN 3′-UTR, and the MT binding site of the PTEN 3′-UTR. PTEN was confirmed as a direct downstream target of miR-19a by TargetScanHuman. (D) A luciferase reporter gene activity assay was performed following co-transfection of PTEN 3′UTR MT/WT and miR-19a inhibitor or negative control. miR-19a inhibited the luciferase activity of the WT luciferase plasmid, while there was no significant difference when the miR-19a inhibitor was co-transfected with the MT luciferase plasmid. For part B, ***P<0.001 vs. blank or negative control groups; for part D, ***P<0.001, as indicated. In part B, the Pter-only treatment group was compared with the blank control group, while the miR-19a inhibitor and Pter + miR-19a inhibitor groups were compared with the negative control group. Pter, pterostilbene; miR, microRNA; WT, wild type; phosphatase and tensin homolog; UTR, untranslated region; MT/mut, mutant type; ns, not significant.

