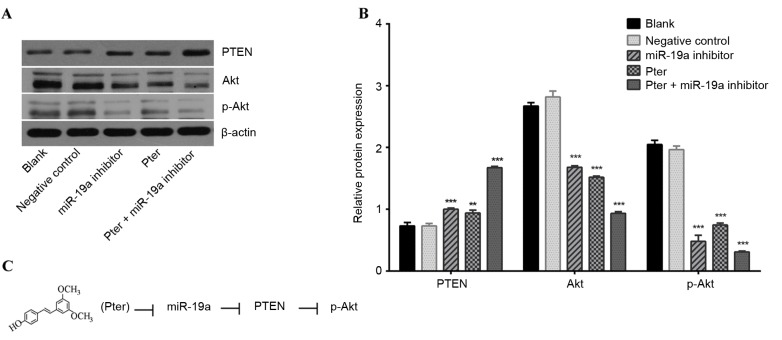
Figure 5.
PTEN, Akt and p-Akt levels in SMMC-7721 cells following miR-19a inhibitor transfection and Pter treatment for 24 h. (A) PTEN, Akt and p-Akt levels in SMMC-7721 cells were detected by western blot analysis and representative bands are presented. (B) Relative quantification of western blot analysis results by ImageJ analysis software. (C) Schematic representation of the proposed model of Pter mediation of the PTEN/Akt signaling pathway via miR-19a. **P<0.01 and ***P<0.001 vs. blank or negative control groups. The Pter-only treatment group was compared with the blank control group, while the miR-19a inhibitor and Pter + miR-19a inhibitor groups were compared with the negative control group. PTEN, phosphatase and tensin homolog; p-, phosphorylated-; miR, microRNA; Pter, pterostilbene.

