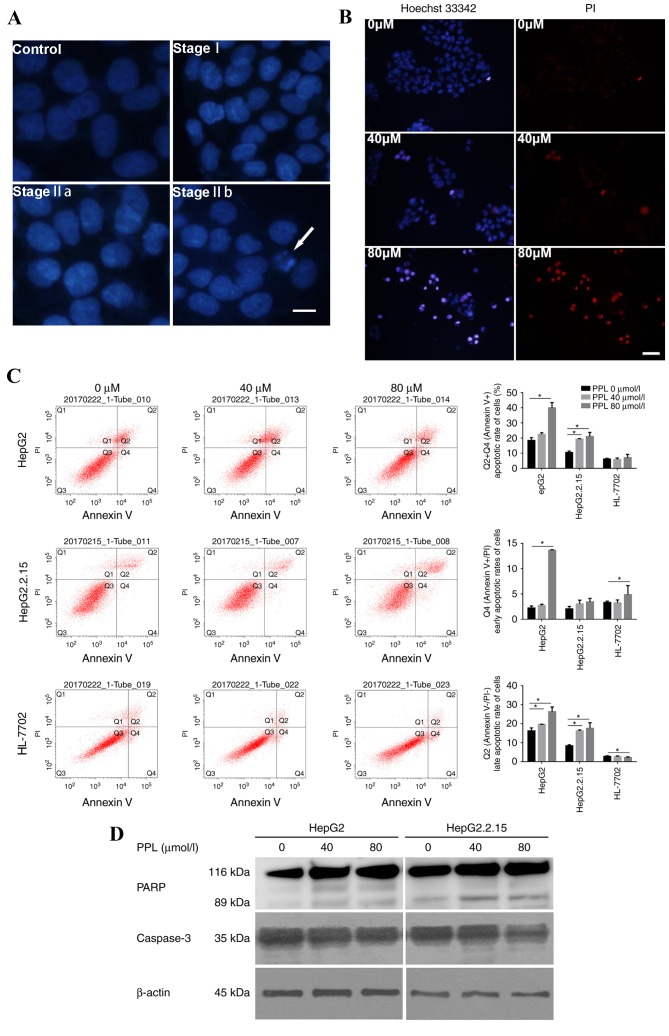
Figure 3.
PPL treatment induced the apoptosis of HepG2 and HepG2.2.15 cells. (A) Representative DAPI staining images of HepG2 cells cultured with or without PPL for 48 h. The nuclei of HepG2 without PPL treatment (the control) were homogeneously stained and regularly shaped. Following treatment with PPL, the HepG2 cells demonstrated the characteristics of stage I apoptosis; the nuclei of HepG2 cells were corrugated and chromatin condensation was visible. In stage IIa, the nuclei displayed chromatin condensation and marginalization. In stage IIb, the nuclei of HepG2 cells were cleaved and apoptotic bodies were formed. The white arrow indicates an apoptotic body. Scale bar, 25 µm. (B) Representative images of the Hoechst 33342/PI double staining of HepG2 cells cultured with different concentrations of PPL for 48 h. Incubation with 80 µmol/l PPL induced the Hoechst 33342 (blue) and PI (red) staining of HepG2 cells, which was visibly increased compared with 0 µmol/l PPL. Scale bar, 50 µm. (C) PPL increased the rate of apoptosis for HepG2 and HepG2.2.15 cells, while it exhibited no significant effect on the apoptosis of HL-7702 cells, as demonstrated by flow cytometry. Q1, Annexin V-FITC−/PI+, necrotic cells; Q2, Annexin V-FITC+/PI+, late apoptotic cells; Q3, Annexin V-FITC−/PI−, viable cells; Q4, Annexin V-FITC +/PI−, early apoptotic cells. The apoptotic rate was calculated based on the sum of quadrants 2 and 4, which included all Annexin V-FITC+ cells. *P<0.05. (D) In HepG2 and HepG2.2.15 cells treated with different concentrations of PPL for 48 h, the expression of full-length caspase3 decreased, and expression of the PARP fragment (89 kDa) increased, as demonstrated by western blotting. PPL, propranolol hydrochloride; PI, propidium iodide; PARP, poly (ADP-ribose) polymerase. *P<0.05.

