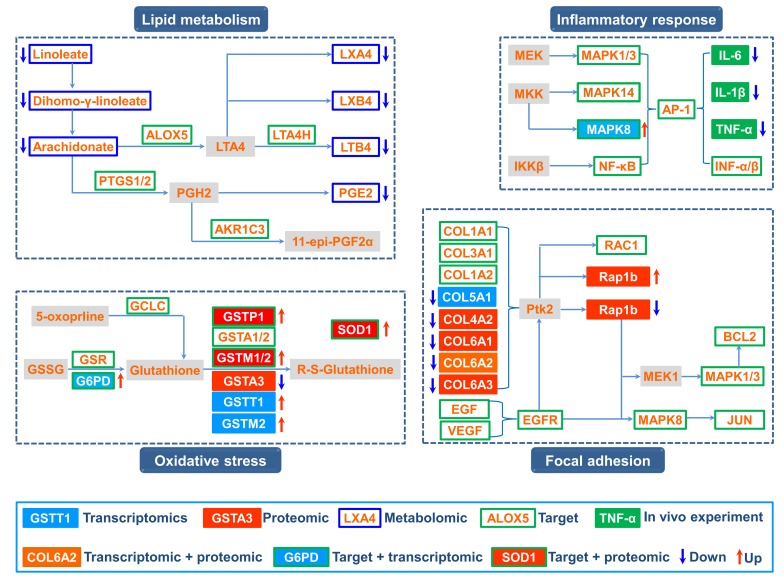
Figure 4.
Comprehensive analysis of the potential targets of BYF, and the regulated genes, proteins and metabolites in the lung tissues of BYF-treated rats. The potential targets, genes, proteins and metabolites are presented as different-colored rectangles. Regulation is color-coded: Red arrow indicates upregulation, blue arrow indicates downregulation, and a gray rectangle represents no regulation. BYF, Bufei Yishen formula.

