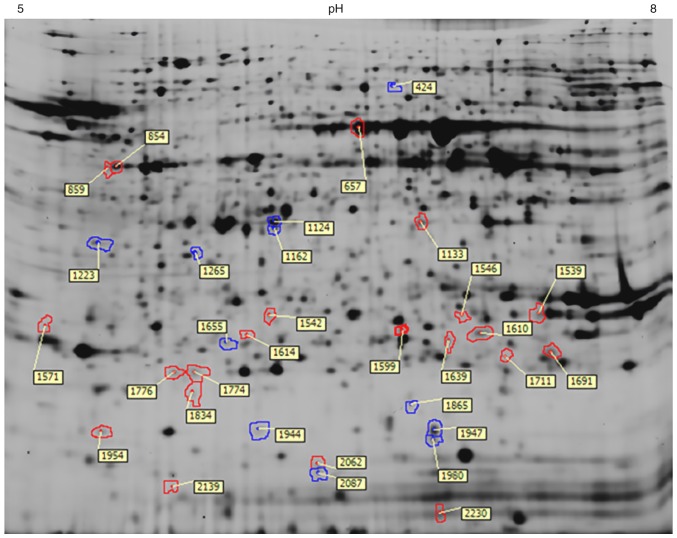
Figure 1.
A representative difference gel electrophoresis gel image showing the locations of those differentially expressed proteins in guinea pig retinas after lens-induced myopia for 8 days. Spots in blue indicate upregulated proteins in myopic retina, while those in red indicate downregulated proteins. The number of each spot indicated the spot numbers used in the analysis of DeCyder software.

