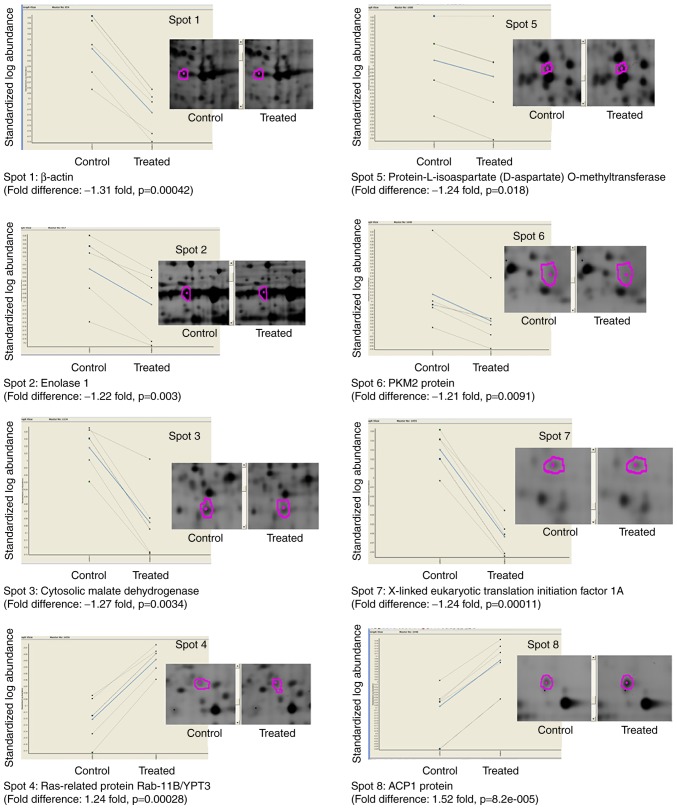
Figure 2.
Differential protein expressions of the 8 proteins identified by tandem mass spectrometry with averaged fold changes and P-value shown. Solid lines represented averaged group expression while dotted lines denoted individual expression (n=5). The standardised log abundance of protein spot (y-axis) was plotted against control and treated retinas (x-axis). Purple circles indicate the boundaries of the protein spots automatically detected by the DeCyder Differential Analysis software. ACP1, adipocyte acid phosphatase; PKM2, pyruvate kinase PKM.

