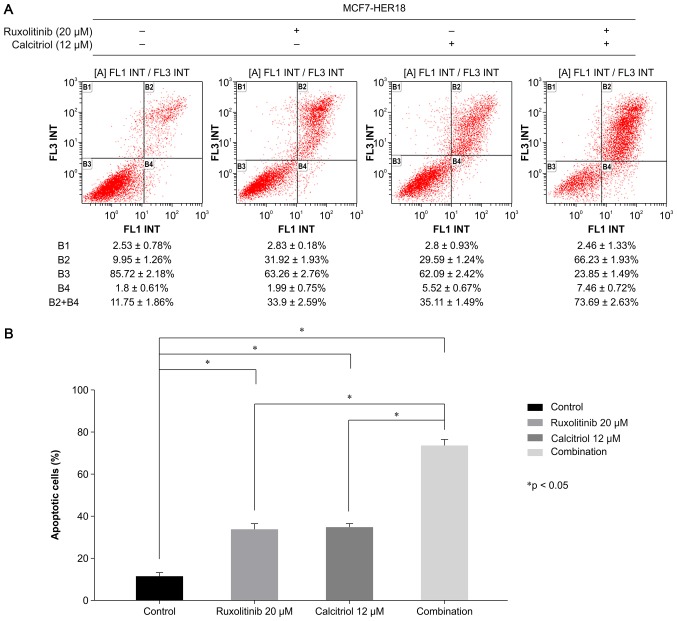
Figure 4.
Flow cytometry analysis of Annexin-FITC/PI stained MCF7-HER18 cells was performed. Following exposure to the indicated treatments for 72 h. (A) B1 quadrant (Annexin−, PI+) represents necrotic cells, B2 quadrant (Annexin+, PI+) represents late apoptotic cells, B3 quadrant (Annexin−, PI−) represents viable cells, and B4 quadrant (Annexin+, PI−) represents early apoptotic cells. (B) The graph shows the proportions of early and late apoptotic cells following 72 h of treatment as indicated. The data are presented as the mean ± standard deviation. *P<0.05. FITC, fluorescein isothiocyanate; PI, propidium iodide; HER, human epidermal growth factor receptor.

