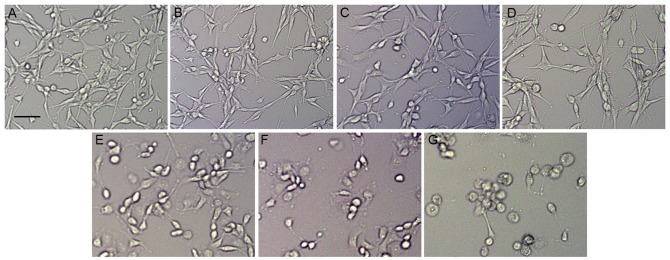
Figure 1.
Phase contrast microscopy of morphological changes in U-87MG cells treated with ouabain. Cells were treated with different concentrations of ouabain for 24 h. (A) Control group. (B) 0.05 µmol/l ouabain, (C) 0.25 µmol/l ouabain, (D) 0.5 µmol/l ouabain, (E) 2.5 µmol/l ouabain (F) 5 µmol/l ouabain and (G) 25 µmol/l ouabain. Scale bar=200 µm.

