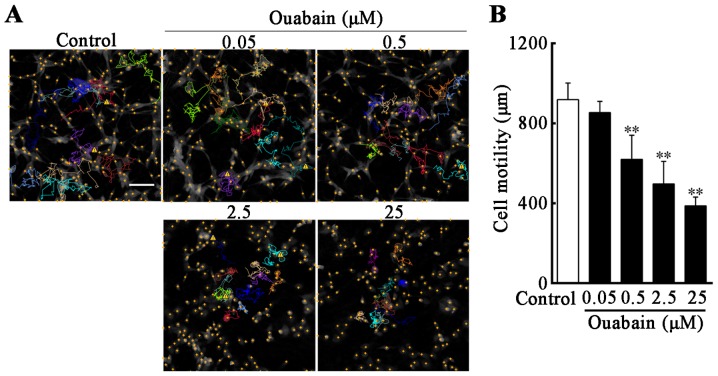
Figure 3.
Inhibition of U-87MG cell motility is induced by ouabain. Cells were treated with the indicated concentrations of ouabain for 24 h. (A) Motion tracking of selected cells in the imaging area was performed using HoloStudio 2.6.2 software. The curved colored lines represent the moving path of selected wells during 24 h treatment and the yellow cross dots indicate cell nuclei in the imaging field. (B) Cell motility was measured as the distance of cell movement throughout the 24 h time-lapse video and analyzed using HoloStudio 2.6.2 software. Scale bar=100 µm. **P<0.01, vs. control group.

