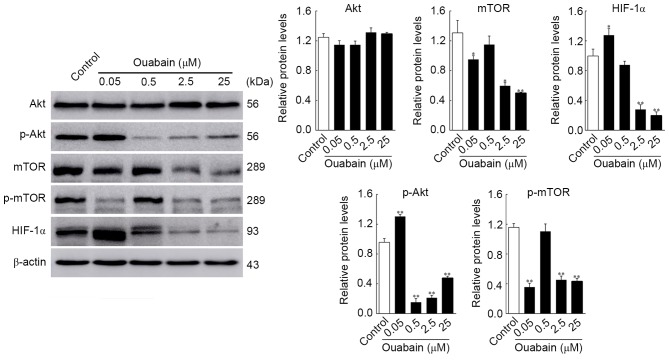
Figure 4.
Changes in expression levels of Akt, p-Akt, mTOR, p-mTOR and HIF-1α in U-87MG cells are induced by ouabain. Cells were treated with the different concentrations of ouabain for 24 h, following which protein expression was analyzed using western blot analysis and quantified in relation to β-actin. *P<0.05 and **P<0.01, vs. control group. mTOR, mammalian target of rapamycin; p-, phosphorylated; HIF-1α, hypoxia inducible factor-1α.

