
Figure 5.
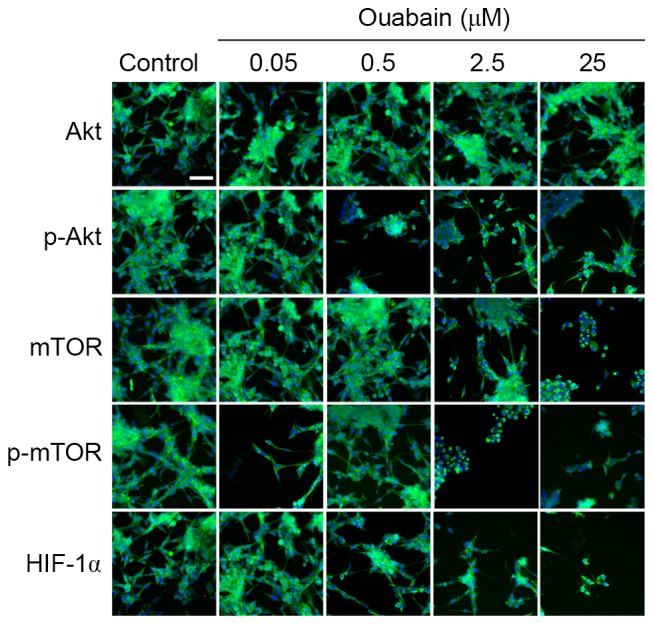
High content screening analyses of the changes in protein levels treated with ouabain. U-87MG cells were treated with the different concentrations of ouabain for 24 h and fluorescence images were captured. Scale bar=50 µm. mTOR, mammalian target of rapamycin; p-, phosphorylated; HIF-1α, hypoxia inducible factor-1α.