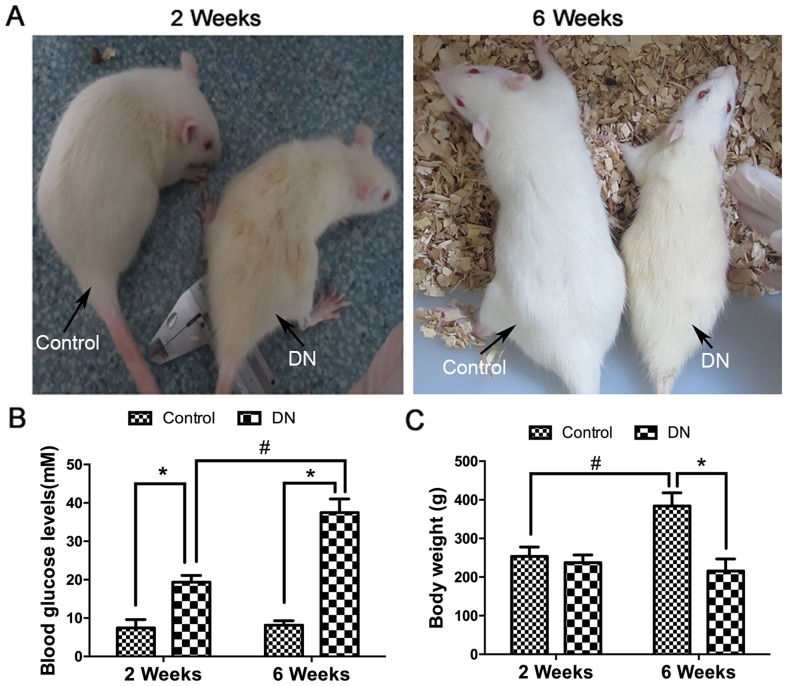
Figure 4.
Blood glucose level and body weight of DN rats. (A) DN was induced in rats by STZ. Wistar rats were photographed 2 and 6 weeks following STZ injection. (B) Blood glucose levels of Wistar rats following STZ injection at 2 and 6 weeks. (C) Body weights of Wistar rats following STZ injection at 2 and 6 weeks. *P<0.05 vs. Control, #P<0.05 vs. 2 weeks. DN, diabetic nephropathy; STZ, streptozotocin.

