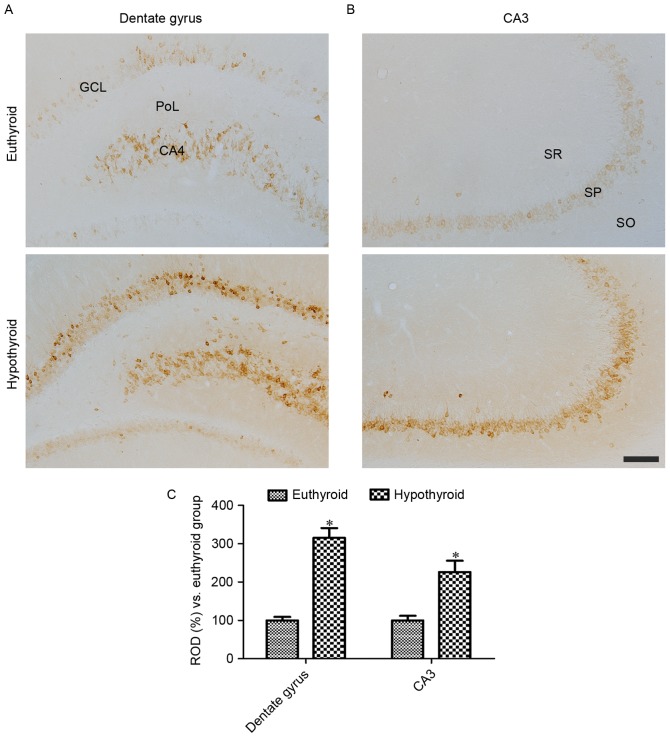
Figure 2.
COX-2 immunoreactivity in the (A) dentate gyrus and (B) CA3 region of euthyroid and hypothyroid rats. COX-2 immunoreactivity is identified in the GCL, PoL and CA4 region of dentate gyrus in addition to in the SP of the CA3 region. COX-2 immunoreactivity is dense in the hypothyroid rats compared with the euthyroid rats. Scale bar, 100 µm. (C) The ROD, expressed as a percentage of the value in the euthyroid group of COX-2 immunoreactivity in the dentate gyrus and hippocampal CA3 region per section. Differences between the means were analyzed using Student's t-test (n=5 per group; *P<0.05 vs. euthyriod). The bars represent the mean ± standard error of the mean. GCL, granule cell layer; PoL, polymorphic layer; SP, SO, stratum oriens; SR, stratum radiatum; SP, stratum pyramidale; ROD, relative optical density.

