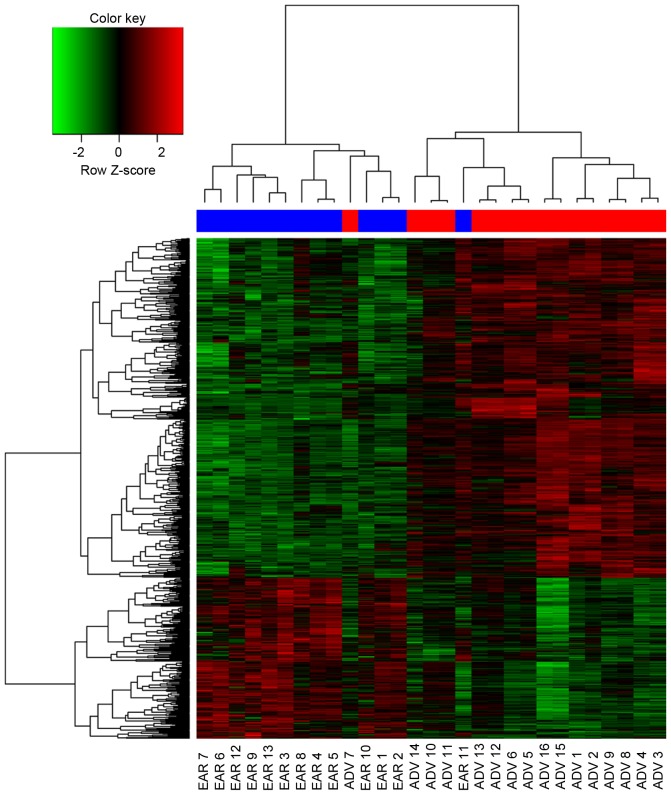
Figure 2.
Heatmap of the DEGs between the two groups and hierarchical cluster analysis. ADV 7 was clustered in the early group, whereas EAR 11 was clustered in the advanced group. Red indicates upregulated DEGs; green indicates downregulated DEGs. ADV, advanced carotid atherosclerotic plaque (red at the top); EAR, early carotid atherosclerotic plaque (blue at the top); DEGs, differentially expressed genes.

