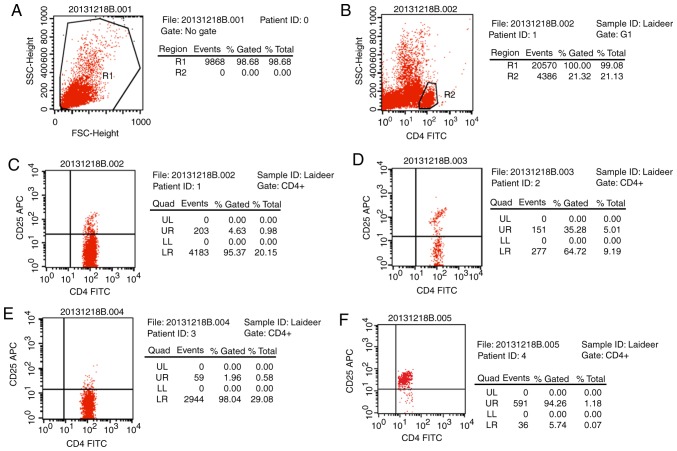
Figure 1.
Purity analysis of the isolated cells. Settings of the (A) T cell and (B) CD4 flow cytometer gates. (C) Ratio of CD4+CD25+ cells in CD4+ T cells. Sample: T cells. (D) Ratio of CD4+CD25+ cells in CD4+ T cells. Sample: CD4+CD127− cells. (E) Ratio of CD4+CD25+ cells in CD4+ T cells. Sample: CD25− cells. (F) Ratio of CD4+CD25+ cells in CD4+ T cells Sample: CD4+CD25+ cells. FSC, forward scatter; CD, cluster of differentiation; FITC, fluorescein isothiocyanate; UR, upper right; UL, upper left; LL, lower left; LR, lower right; APC, allophycocyanin; SSC, side scatter.

