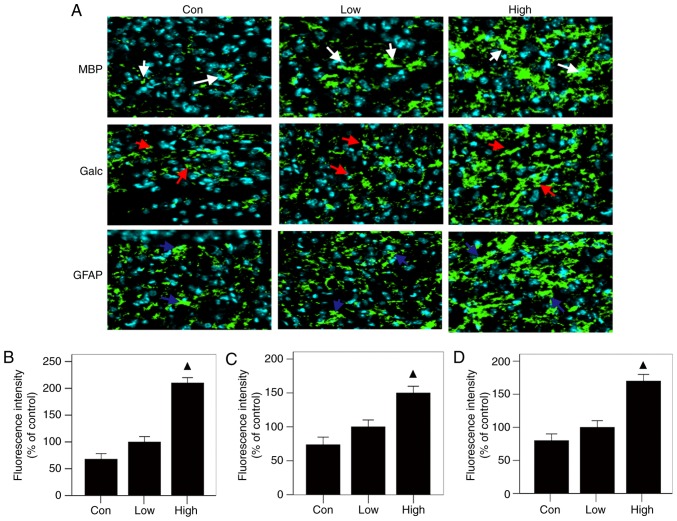
Figure 4.
Relative tissue repair related proteins expression levels after operation. (A) Results of MBP, Galc and GFAP immunofluorescent staining (white arrows: MBP, red arrows: Galc, blue: GFAP). (B-D) Analysis of results: The levels of MBP, GFAP and Galc, in the high-n-3 PUFA diet group were all significantly lower. ▲Comparison with the low-n-3 polyunsaturated fatty acid (PUFA) diet group and the control group, P<0.05.

