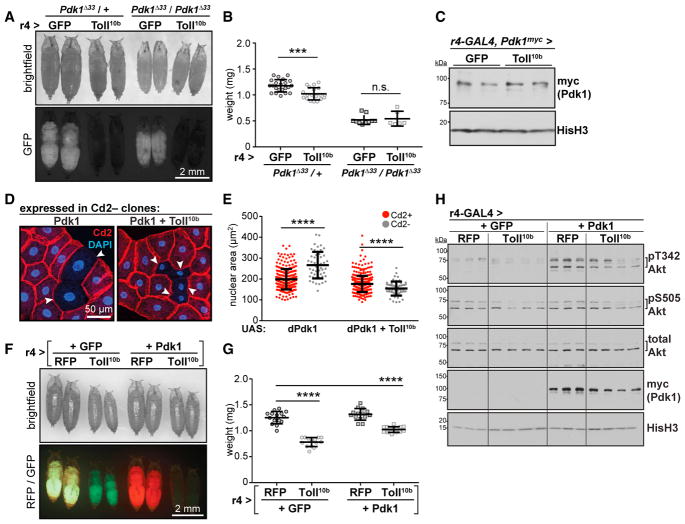
Figure 3. Toll Signaling Acts at or Downstream of Pdk1 to Block Growth.
(A) Images of Pdk1Δ33 mutant pupae expressing GFP or Toll10b in fat body. Scale bar, 2 mm.
(B) Pupal body weights, n = 19–22/gp for Pdk1Δ33/+, n = 6–10/gp for Pdk1Δ33/Pdk1Δ33. ***p = 0.0002 versus GFP.
(C) Western blot analysis of endogenous Pdk1 with a C-terminal myc tag (Pdk1myc) in fat bodies expressing GFP or Toll10b, n = 2/gp.
(D) Micrographs of fat bodies containing Cd2−, GAL4+ cells (arrowheads) expressing Pdk1 (left) or Pdk1 + Toll10b (right). WT cells are Cd2+ (red); nuclei are stained with DAPI (blue). Scale bar, 50 μm.
(E) Nuclear area in Cd2+, GAL4− cells (red, Pdk1, n = 262; Pdk1+Toll10b, n = 379) and Cd2−, GAL4+ cells (gray, Pdk1, n = 50; Pdk1+Toll10b, n = 55). ****p < 0.0001 versus Cd2+.
(F) Images of pupae. Scale bar, 2 mm.
(G) Pupal body weights, n = 14–15/gp. ****p = 0.0001 versus RFP + GFP.
(H) Western blot analysis of pT342, pS505, and total Akt, transgenically expressed Pdk1 (myc-tagged) and Histone H3 (HisH3) in fat bodies, n = 3–4/gp. Data are presented as mean ± SD. See also Table S1 and Figures S1, S3, and S4.

