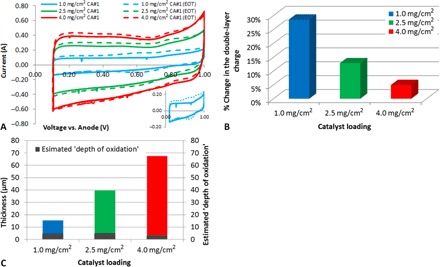
Fig. 4. Comparison of the change in double layer charge for each MEA between beginning of test (BOT) and end of test (EOT).

(A) CVs obtained before and after the stability test. The inset highlights the pseudocapacitive peaks for the 1.0-mg/cm2 design. (B) Percent increase in double-layer charge following the stability test for each of the three loadings. (C) Measured (scanning electron microscopy cross section) CCL thickness and estimated depth of oxidation into the CCL.
