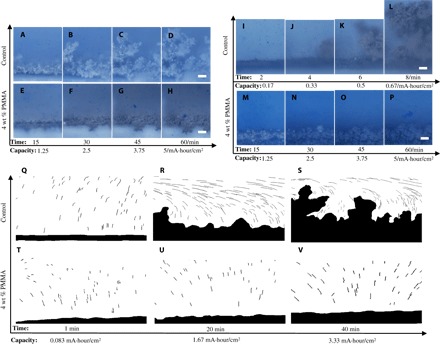
Fig. 3. Snapshots of interface evolution during electrodeposition in Li||stainless steel and Na||stainless steel optical cells operated above the limiting current.

(A to D) Electrodeposition of Li in a Newtonian liquid control electrolyte (EC/PC–1 M LiTFSI). (E to H) Li electrodeposition in a viscoelastic liquid electrolyte (4 wt % PMMA in EC/PC–1 M LiTFSI). (I to L) Na deposition in a Newtonian liquid electrolyte [EC/PC–1 M sodium perchlorate (NaClO4)]. (M to P) Na electrodeposition in a viscoelastic electrolyte (4 wt % PMMA in EC/PC–1 M NaClO4). Scale bars, 100 μm. (Q to S) Flow patterns obtained by tracking tracer particle motions at different stages of the lithium electrodeposition in a Newtonian liquid EC/PC–1 M LiTFSI. (T to V) Flow patterns in a viscoelastic liquid electrolyte (4 wt % PMMA in EC/PC–1 M LiTFSI).
