
Figure 3. Proteins and the enzymatic activities of major H2S-generating enzymes are upregulated in 5-FU-resistant HCT116 cells.
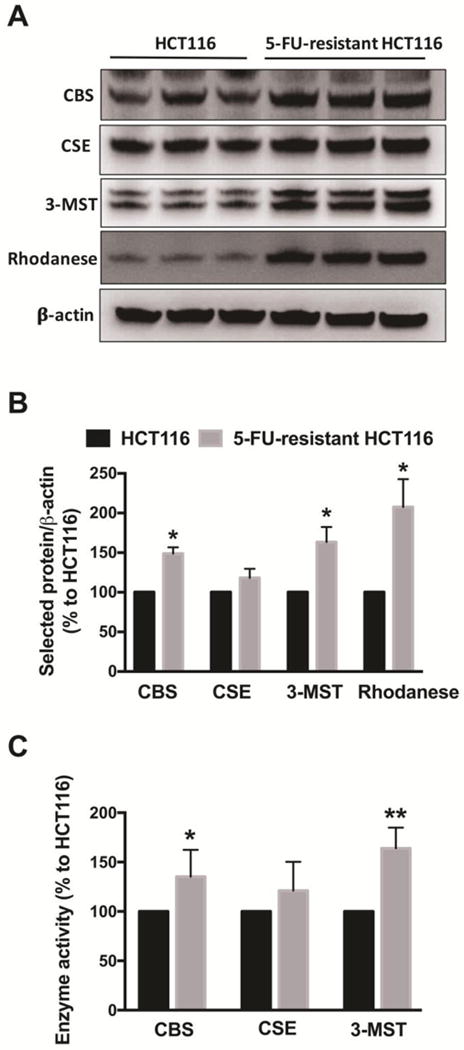
(A) Representative western blot images of CBS, CSE, 3-MST and rhodanese are shown. (B) The density of the H2S-producing enzymes was normalized to that of β-actin and expressed as a percentage of the corresponding HCT116 group. n = 3–6 per group. *P < 0.05 vs. HCT116 CTL. (C) The enzymatic activity of CBS, CSE and 3- MST were analyzed as described in Material and Methods and expressed as a percentage to the corresponding HCT116 group. n = 3–4 per group. Data represent mean ± SEM. *P < 0.05, ** P < 0.01 vs. HCT116 cells (based on unpaired Student’s t test).