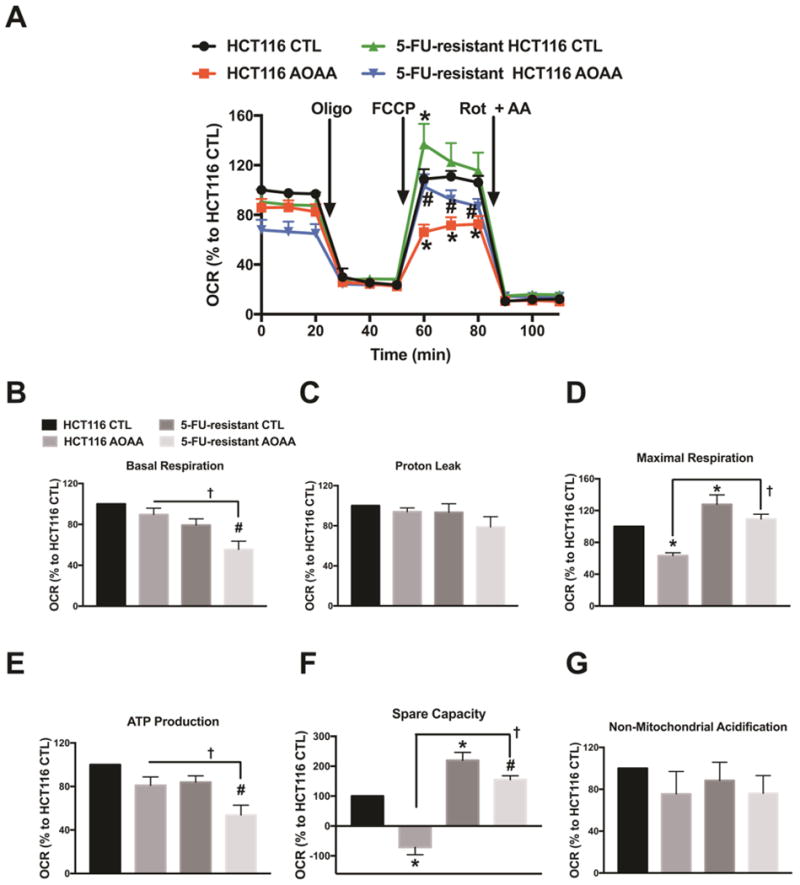
Figure 8. Comparison of aerobic respiration in control and 5-FU-resistant HCT116 cells; effect of AOAA.

(A) Oxygen consumption rate (OCR) in HCT116 and 5-FU-resistant HCT116 cells (FCCP: carbonyl cyanide 4-(trifluoromethoxy)phenylhydrazone, a mitochondrial oxidative phosphorylation uncoupler; Rot: rotenone; and AA: antimycin A; inhibitors of complex I and III, respectively). (B–E) Comparison of cellular bioenergetics parameters based on OCR. Data represent mean ± SEM. n = 4–6 per group. *P < 0.05 vs. HCT116 CTL; #P < 0.05 vs. 5-FU-resistant HCT116 CTL; †P < 0.05 (based on two-way ANOVA corrected with Tukey’s post-hoc test).
