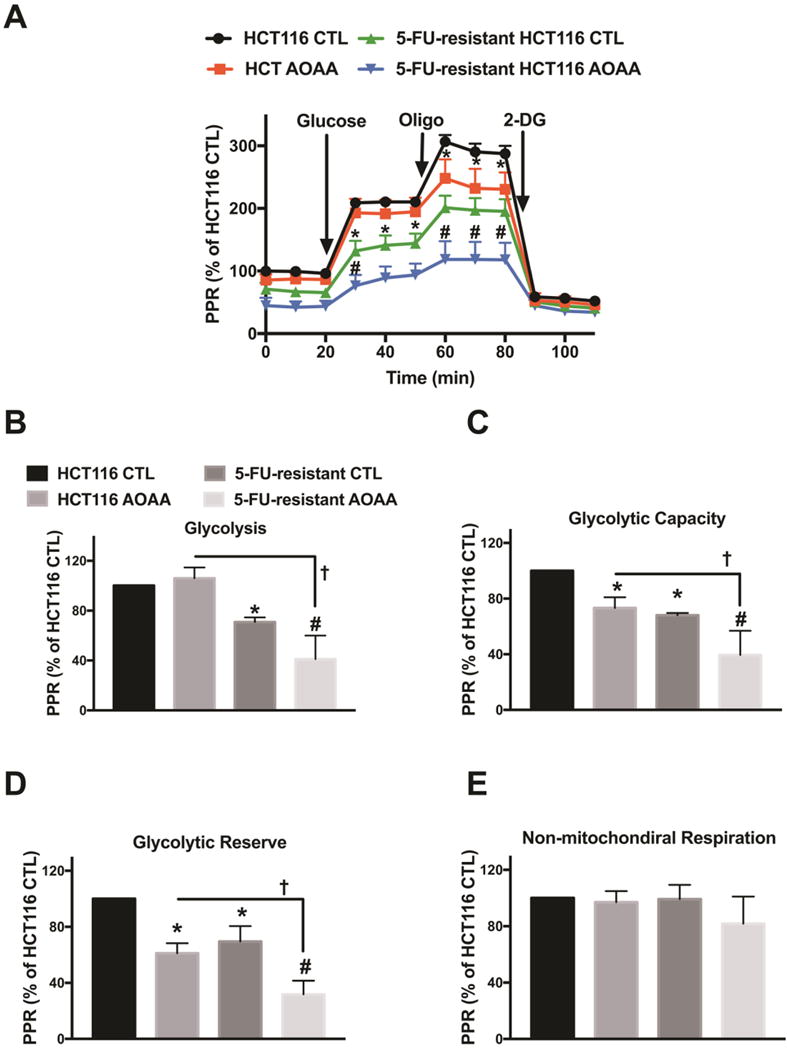
Figure 9. Comparison of glycolysis in control and 5-FU-resistant HCT116 cells; effect of AOAA.

HCT116 and 5-FU-resistant HCT116 cells were treated with or without 0.3 mM AOAA for 1 h. Extracellular Flux Analysis was then performed. (A) Changes in the prolife of proton production rate (PPR) in HCT116 or 5-FU-resistant HCT116 cells (oligo: oligomycin, an inhibitor of ATP synthase; 2-DG: 2-deoxy-D-glucose; an inhibitor of glycolysis). (B–E) Comparison of cellular bioenergetics parameters based on PPR. Data represent mean ± SEM. n = 4–6 per group. *P < 0.05 vs. HCT116 CTL; #P < 0.05 vs. 5-FU-resistant HCT116 CTL; †P < 0.05 (based on two-way ANOVA corrected with Tukey’s post-hoc test).
