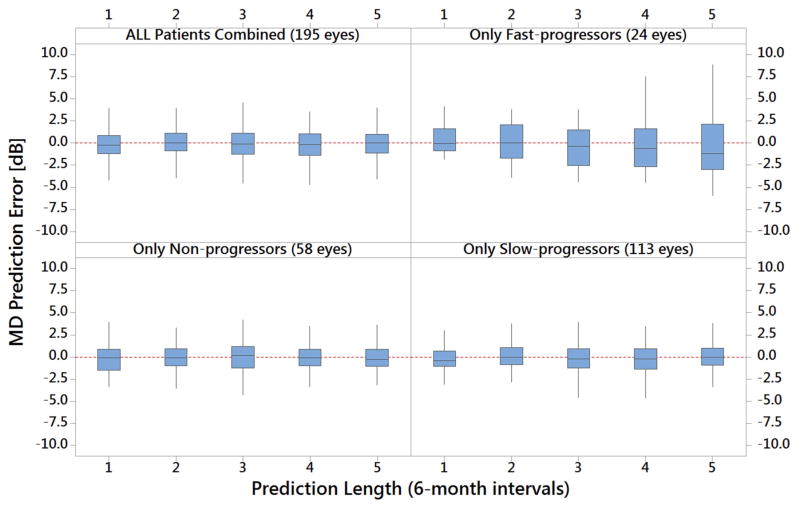
Figure 1. Prediction Errors of KF, KS, and KN Models for All Patients in the Testing Dataset after Stratification by Progression Status.
MD = mean deviation; dB = decibels. Each 6-month prediction interval is from Period 5.
The figure shows prediction errors for the three customized Kalman filter models separately, as well as all combined. It shows that overall and for all 3 progression status groups, the mean MD prediction error is rather small with the forecasts within 1 dB of the actual observations from the trial. The largest prediction errors were when the model forecasted far into the future for subset of patients who were fast-progressors. Patients were required to have 10 or more IOP, MD, and PSD measurements for inclusion in this analysis.

