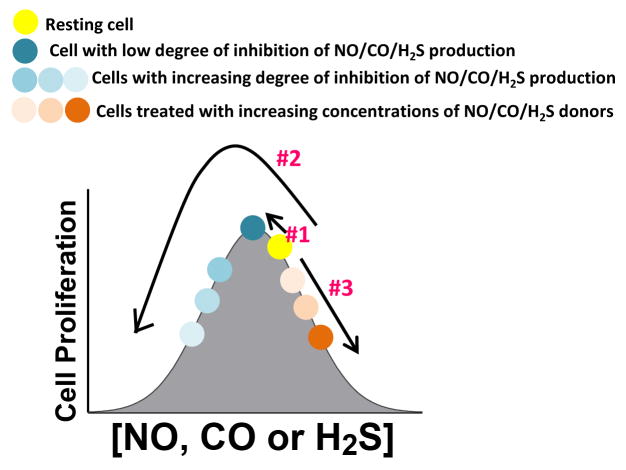
Figure 15. Working hypothesis: consequences of the bell-shaped pharmacological profile of NO, CO and H2S on the proliferation of HCT116 cells.
Optimal concentrations of nitric oxide (NO), carbon monoxide (CO) and hydrogen sulfide (H2S), produced endogenously by NO synthases (eNOS, iNOS, nNOS), heme oxygenases (HO-1 and HO-2) and the H2S-producing enzymes (primarily cystathionine-β-synthase [CBS] and 3-mercaptopyruvate sulfurtransferase, 3-MST), respectively, support tumor growth and proliferation. Each of the three gasotransmitters regulates tumor cell proliferation according to a bell-shaped concentration-response curve. The data obtained in the current study can be best interpreted if we hypothesize that the resting point of the tumor cells, under control conditions, is to the right from the top of the bell-shaped curve. Partial inhibition of NO, CO or H2S production moves the cells towards the top of the curve, thereby explaining the slight enhancement of cell proliferation seen with low inhibitor concentrations (Arrow #1). More complete inhibition of NO, CO or H2S production moves the cells down on the left shoulder of the curve thereby explaining the dose-dependent inhibition of cell proliferation seen at higher inhibitor concentrations. (Arrow #2) (At the highest inhibitor concentrations, the inhibitors may also affect other cellular processes, best exemplified by the effects of ZnPPIX in the current study). Donation of excess NO, CO or H2S (in addition to what the cells already produce endogenously) production moves the cells down on the right shoulder of the curve (Arrow #3), thereby explaining the concentration-dependent inhibition of cell proliferation seen with donors, and also explaining why low concentrations of the donors - as opposed to the inhibitors - do not increase cell proliferation.

