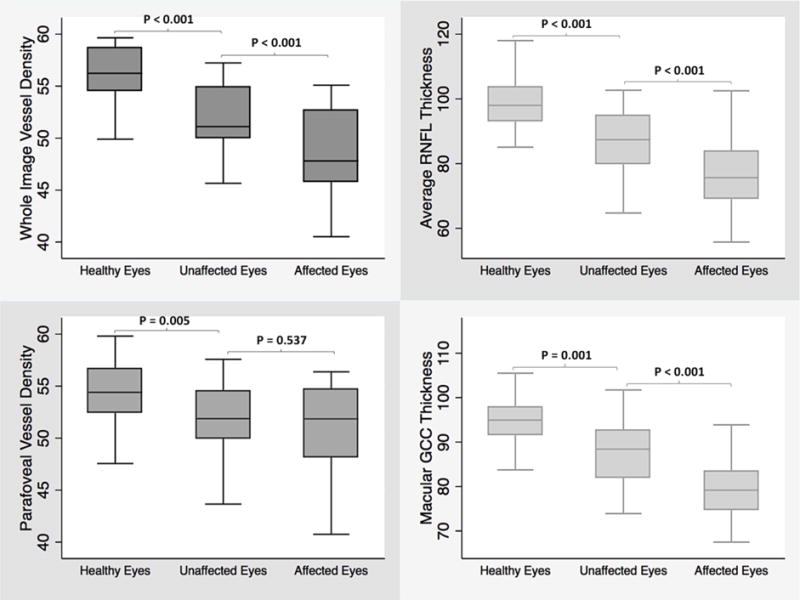
Figure 3.

Boxplots illustrating the distribution of whole image vessel density (top left), average retinal nerve fiber layer thickness (top right), parafoveal vessel density (bottom left), and macular ganglion cell complex thickness (bottom right) measurements in healthy, unaffected and affected eyes of glaucoma patients with unilateral visual field loss. The medians are represented by horizontal line in the gray box. Error bars denote interquartile range
