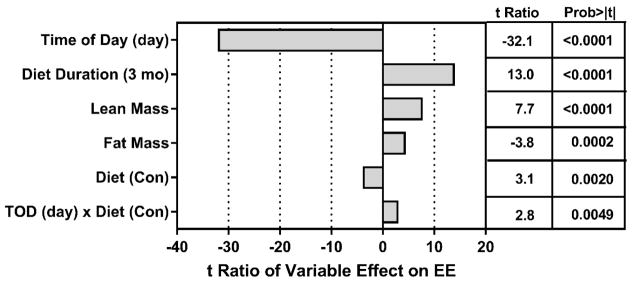
Figure 1. Assessment of components contributing to variation in energy expenditure (EE) in the Juvenile Study.
The relative contributions of model components in accounting for variation in total EE is shown as the t ratio of each variable’s impact on EE and was calculated by Analysis of Covariance. EE was measured in rats by indirect calorimetry after consuming the Control or MR diet for 3 months or 9 months beginning at 6 weeks of age. At each time point, the rats were acclimated in the metabolic chambers for 24 h prior to measurement of oxygen consumption (VO2) and carbon dioxide production (VCO2) at 48-min intervals for 72 h. EE was calculated as described in the Materials and Methods.

