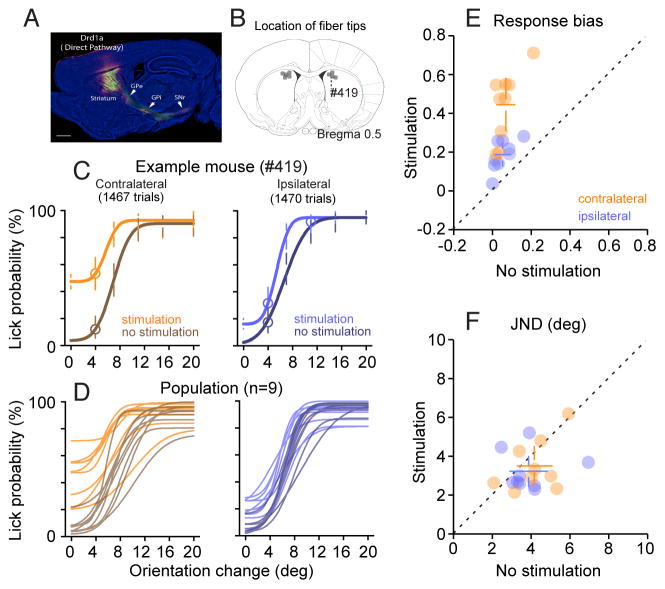
Figure 2. Optogenetic activation of the direct pathway increased response bias preferentially for visual events on the contralateral side.
(A) Sagittal section of an example Drd1a mouse, showing Cre-dependent viral expression in the striatum and downstream axonal targets of transfected neurons (GPi, SNr and GPe). Scale bar,1mm. Yellow: YFP, magenta: anti-GFP/YFP antibody staining. (B) Summary of unilateral optic fiber tip placements in the striatum of all the Drd1a-cre used in the study (grey dots). The number label indicates the tip placement for the example mouse whose data are shown in C. (C) Psychometric data of an example Drd1a-cre mice. Circles show lick probability pooled across sessions for each orientation change tested. Smooth curves show fitted cumulative Gaussian function. Error bars show 95% confidence interval. Left: psychometric data for orientation change contralateral to the optic fiber implant, with (orange) and without (brown) optical stimulation. Right: psychometric data for orientation change ipsilateral to the optic fiber implant, with (light blue) and without (dark blue) optical stimulation. (D) Fitted psychometric curves from all Drd1a mice (n=9); each curve is from one mouse. Left: psychometric curves for performance during blocks containing contralateral visual events, with (orange) and without (brown) stimulation. Right: psychometric curves during blocks with ipsilateral visual events, with (light blue) and without (dark blue) stimulation. (E) Comparison of response biases from psychometric curves with and without dMSN stimulation, during blocks containing contralateral (orange) and ipsilateral (blue) visual events. Filled circles are data from each mouse, open circles represent population average. Error bars are 95% CI. (F) Comparison of JNDs from psychometric curves with and without dMSN stimulation. See also Figure S1.

