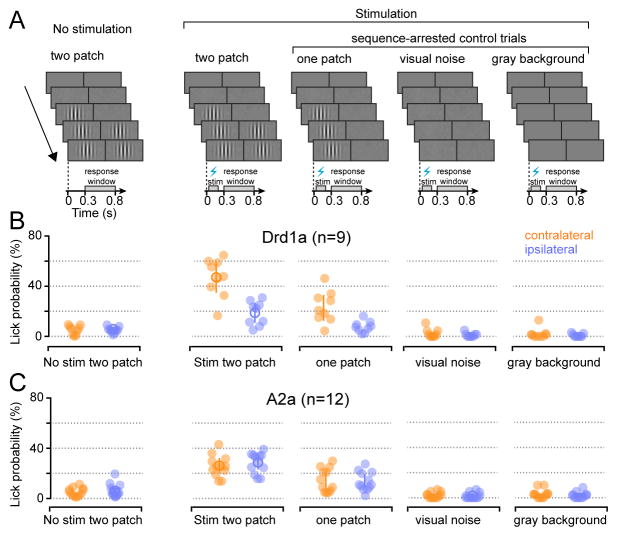
Figure 7. Changes in performance caused by striatal stimulation depended on the presence of behaviorally relevant visual stimuli.
(A) Schematics of visual displays and timing of optogenetic stimulation in sequence-arrested control trials and normal no-change (‘two-patch’) trials. All sequence-arrested control trials had optical stimulation at a distance equivalent to normal trials, and were interleaved with 12° cha nge and no-change trials. (B) Lick probability during response window observed across different conditions in Drd1a-cre mice when visual event could occur in contralateral (orange) and ipsilateral (blue) hemifield. Filled circles represent data from individual mice, open circles show population mean. Error bars are 95% CI. (C) Lick probability during response window observed across different conditions in A2a-cre mice.

