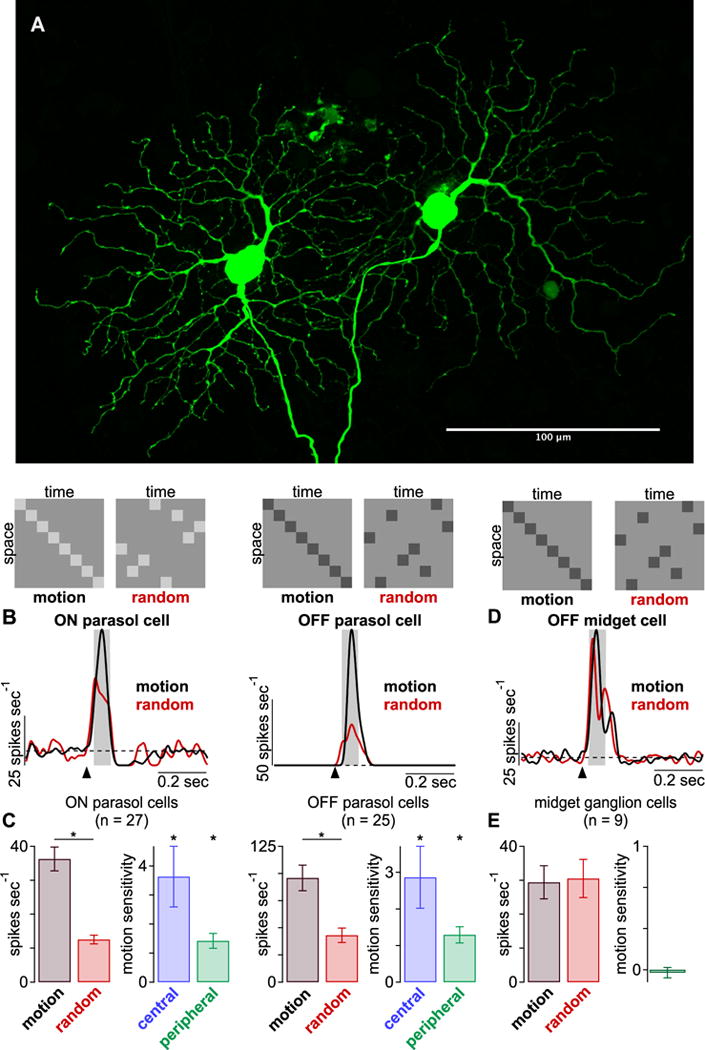
Figure 1.

Parasol cells distinguish between apparent-motion and random-bar sequences. (A) Maximum projection of two neighboring ON parasol cells recorded for this study (scale bar, 100 μm). (B) Top, example spatiotemporal patterns are shown for the two stimulus classes. Mean spike responses from example ON and OFF parasol cells to the apparent-motion (black) and random-bar sequences (red). Arrow indicates stimulus onset; shaded regions indicate sampling windows. (C) Spike responses (left) and motion sensitivity (right) across ON (n = 27) and OFF (n = 25) cells. Motion sensitivity values are shown for central (blue, ≤3 mm) and more peripheral (green, >3 mm) eccentricities. Motion stimuli elicited significantly larger spike response than random sequence in both cell types (p < 0.05). Motion sensitivity was also significant for both types. (D) Same as (B) for an OFF midget ganglion cell. (E) Same as (C) for midget ganglion cells (n = 9). Bar plots indicate mean ± SEM.
