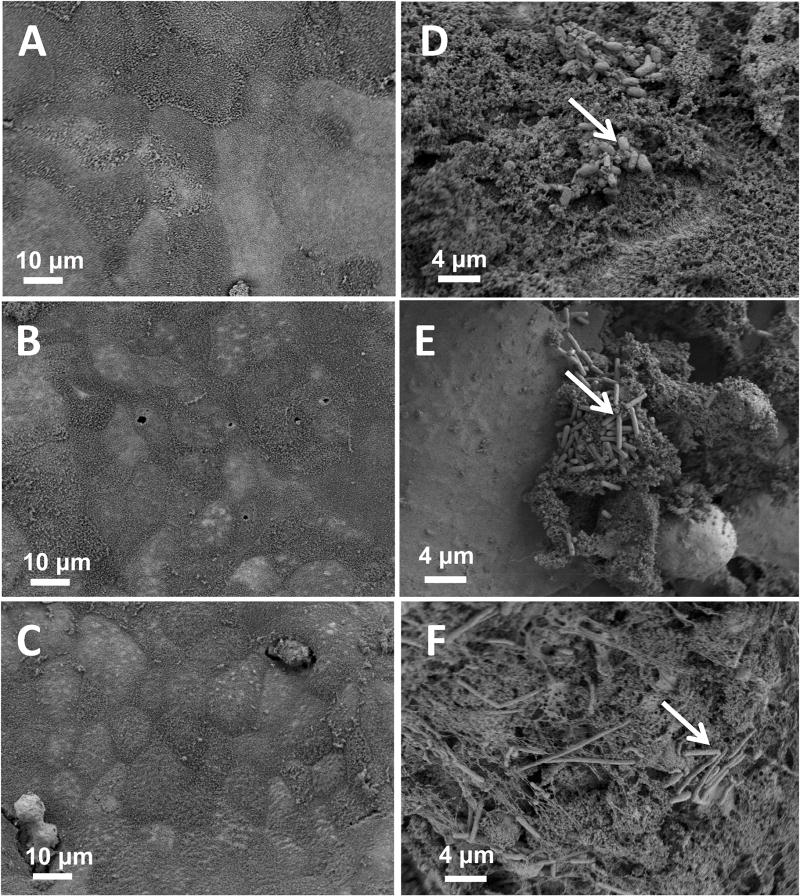
Figure 5. Scanning electron microscopy of 3D scaffolds infected with UK1 C. difficile for different times.
Scaffolds were visualized by scanning electron microscopy at different times after infection with 5×10⁶ C. difficile UK1 spores. (A–C) uninfected controls; (D–F) scaffolds infected with UK1 spores. Samples were collected for SEM at 4 hrs (A and D), 24 hrs (B and E) or 48 hrs (C and F). White arrows indicate germinated spores. Samples shown are representative of at least 4 scaffolds examined at each time point from at least two independent experiments.

