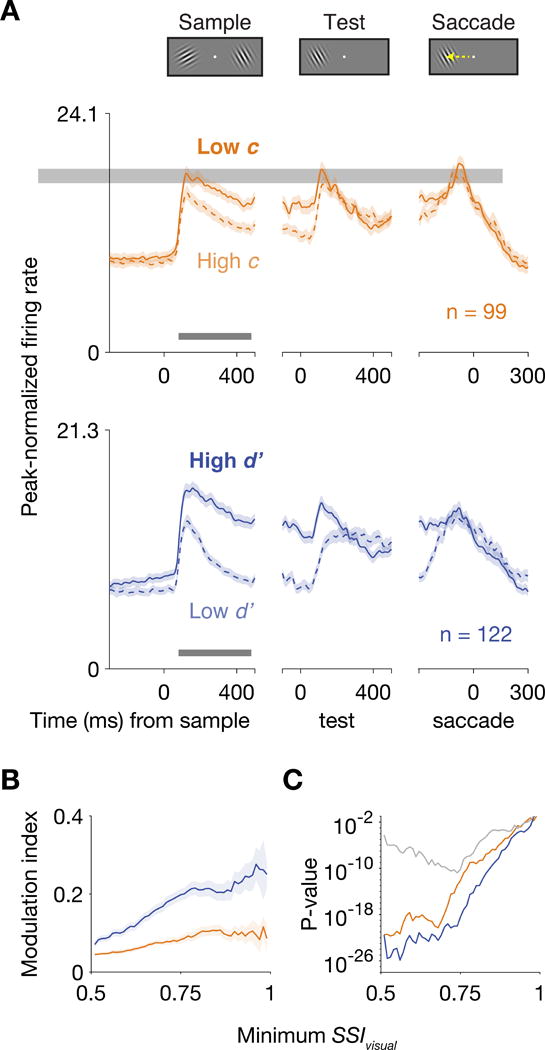
Figure 4. Visual responses increased when the subject either lowered its criterion or increased its sensitivity.

(A) PETH of units with SSIvisual > 0.75 during the attention task. Orange lines represent units recorded during Δc isolations, and blue lines represent units from Δd′ isolations. Spikes were convolved with a Gaussian with σ = 8 ms. The maxima of the y-axes are 0.75 times the average peak firing rate across the population. Shading indicates mean ± SEM. The bar near the x-axis indicates the sample period (80-480 ms after sample onset). Either lowering c or elevating d′ increased the firing rates of visual neurons throughout the sample period and into the test period. (B) Modulation index (MI) of firing rates during the period 80-480 ms after sample onset as function of the minimum SSIvisual of the units included for analysis. A Δc-related modulation index > 0 indicates stronger firing rates when the animal responded more frequently to the contralateral location. A Δd′-related MI > 0 indicates stronger firing rates when the animal was more accurate in discriminating between an orientation change and a match at the contralateral position. Shading indicates mean ± SEM across units. Modulation indices related to either Δc or Δd′ are greater than 0 regardless of the SSIvisual threshold. The sample sizes for minimum SSIvisual = 0.51 were 492 units from Δc isolations and 567 units from Δd′ isolations. (C) P-values were computed using the Wilcoxon signed-rank test for a zero median in the distribution of Δc-related modulation indices (orange) or Δd′-related indices (blue) and from the Wilcoxon rank-sum test of Δc- and Δd′-related indices having the same median (gray). See also Figure S4.
