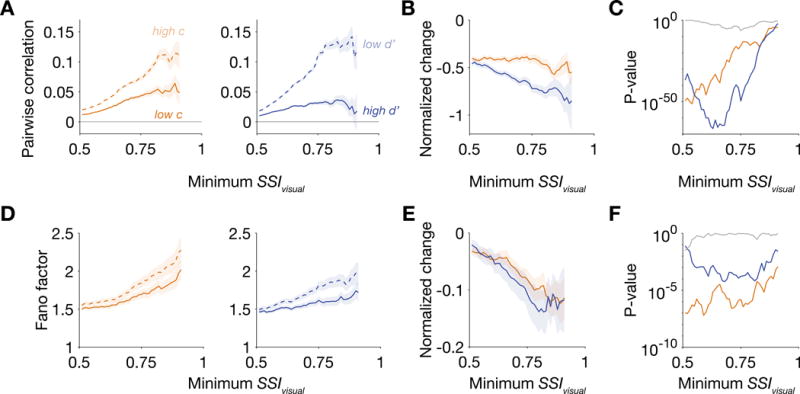
Figure 6. Pairwise correlation and Fano factor decreased when the animal either lowered its criterion or elevated its sensitivity.

(A) Pairwise correlations between contra-selective visual units decreased when the animal performed with a lower criterion or a higher sensitivity at the contralateral hemifield. Correlations were computed using firing rates during the sample period (80-480 ms after sample onset). The sample sizes for minimum SSIvisual = 0.51 and 0.75 were 25273 and 988 pairs from Δc isolations and 26635 and 974 pairs from Δd′ isolations. (B) Changes in pairwise correlation were normalized by the population-averaged correlation in either high c contra condition (for Δc isolations) or the low d′ contra condition (for Δd′ isolations). (C) P-values were computed using the Wilcoxon signed-rank test for a zero median in the distribution of normalized changes related to either Δc (orange) or Δd′ (blue) and using the Wilcoxon rank-sum test of Δc- and Δd′-related correlation changes having the same median (gray). (D) Fano factor of contra-selective visual neurons also decreased when the animal performed with either a lower criterion or higher sensitivity. Fano factor was computed using spike counts during the sample period. The sample sizes for SSIvisual = 0.51 and 0.75 were 492 and 99 units from Δc isolations and 567 and 122 units from Δd′ isolations. (E) Normalized change in Fano factor. (F) P-values for normalized changes in Fano factor. See also Figure S5.
