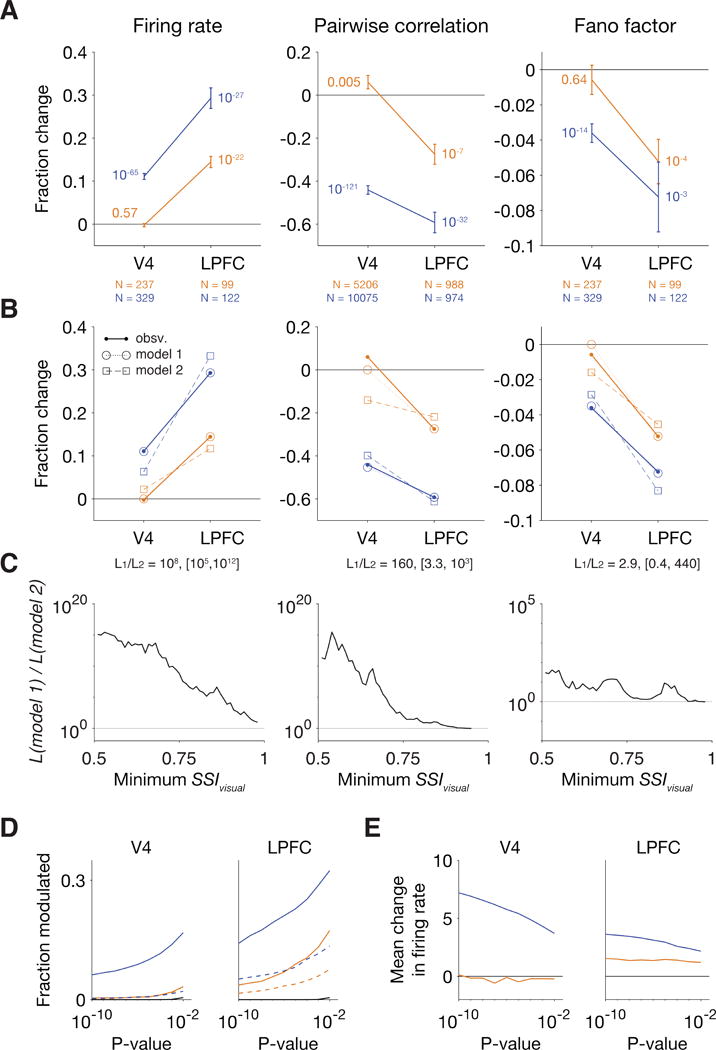
Figure 7. Neuronal modulations related to Δc were reliably observed in the population activity of LPFC but not of area V4.

(A) Normalized change in firing rate, pairwise correlation, and Fano factor of neurons in LPFC and V4 with SSIvisual > 0.75. Error bars indicate mean ± SEM. P-values were computed using a Wilcoxon signed-rank test. (B) Maximum likelihood fits from model 1 (circles and dotted line) and from model 2 (squares and dashed lines). Model 1 assumes zero Δc-related modulations in V4, and model 2 assumes a multiplicative relationship between the modulations in V4 and LPFC. Each model has three parameters. The likelihood ratio and its bootstrapped 95% confidence intervals are indicated at the bottom of the panel. (C) The likelihood ratio of model 1 to model 2 across thresholds of SSIvisual. The likelihood ratio was greater than one (favoring model 1) for all thresholds of SSIvisual for all three measures. For firing rate and pairwise correlation, the bootstrapped 95% confidence interval (shading) of the likelihood ratio was greater than one for a broad range of SSIvisual. (D) The fraction of neurons whose firing rates were significantly modulated in association with either Δc (orange lines) or Δd′ (blue lines) plotted against the threshold for statistical significance. Solid lines indicate the fraction with significantly increased firing rates, and dashed lines indicate the fraction with a significant decrease. Black lines indicate the discovery rate at chance (p-value divided by two). (E) The mean firing rate change across all neurons with an individually significant increase or decrease in their firing rates.
