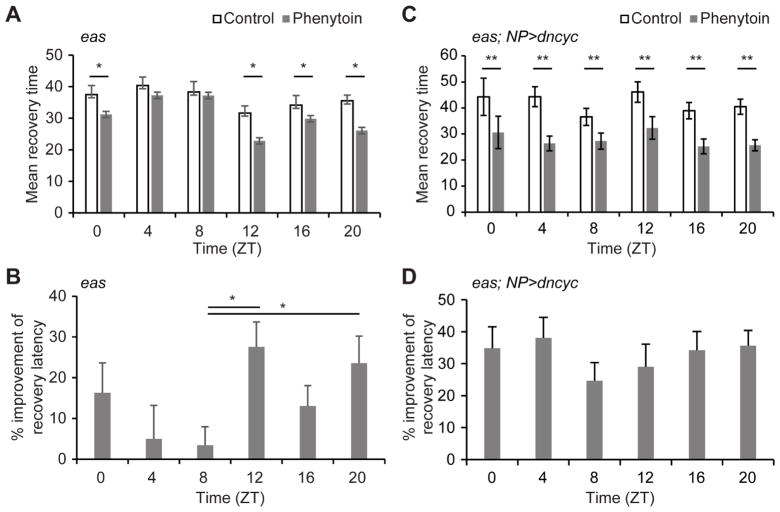
Figure 5. Effect of phenytoin on seizure mutants is dependent on the clock.
15–20 eas mutants were entrained to a 12:12 LD cycle for >3 days, starved for 24 hrs, and fed vehicle or phenytoin for 2 hrs in agar vials. Seizures were induced by mechanical stimulation and the number of seizing flies was counted every 15 secs to calculate mean recovery for each vial. a) Means ± SEM of average recovery latency for each vial, *p<0.05 between vehicle-treated vials and phenytoin-treated vials, shown by paired Student’s t-test. b) Means + SEM of the percentage difference in recovery latency between vehicle and phenytoin are shown. Statistical analysis was performed with one-way ANOVA with post-hoc multiple comparisons Tukey test *p<0.05. c) 15 eas mutants with NP6293-GAL4>UAS-dncyc were entrained and fed vehicle or phenytoin as described above. Means ± SEM are shown. **p<0.01 between vehicle-treated vials and phenytoin-treated vials are shown by Student’s t-test. d) Means + SEM of the percentage difference in the recovery latency between vehicle and phenytoin. Unfortunately we are unable to directly compare recovery times of eas mutants with eas mutants carrying PG-GAL4>UAS-dncyc due to the differences in seizures and kinetics of recovery. All time points of the eas mutants with PG-GAL4>UAS-dncyc at baseline (without drug) had greater mean recovery time, but fewer seizing flies. See also Figure S5.

